
The Performance Index: The Mathematics of Knowing Who Will Fail
A Nebraska strength coach built it in 1969 to keep his job and beat Oklahoma. He could not have known he was creating the first real risk model for athletic talent, or that it would take the market half a century, and the arrival of million-dollar college athletes, to understand what he was building.
It Started With a Threat
Nebraska closed the 1968 season by losing to Oklahoma 47 to 0 on national television. Boosters were passing around a petition to fire the head coach. Out of that wreckage, an injured pole-vaulter named Boyd Epley, who had been rehabbing in the weight room and quietly turning hurt football players into stronger ones, got the chance to run a strength program for the whole team. The athletic director signed off on it the way a man signs off on a gamble he expects to lose. He looked Epley in the eye and told him that if anyone got slower, he was fired.
That one sentence shaped everything that came after. Epley had been handed a narrow, brutal assignment: show, objectively and fast, that the program was not making athletes worse, with his paycheck on the line and Oklahoma waiting on the schedule. Strip away the football and what remains is an exercise in risk management, the kind a bank runs on a loan book, handed to a twenty-something strength coach decades before anyone would have called it that.
So he measured, obsessively, and over the years it grew into something far more useful than a stopwatch. He worked out how to take any athlete's raw numbers and say, with real confidence, where that athlete stood and which way they were heading. The instrument he ended up with behaved more like a tripwire than a talent scout. Its whole reason for existing was to catch trouble early, before it reached the field and cost him his job.
What makes this so remarkable in hindsight is how far ahead of its time the thinking was, and how long it took the market to catch up. For decades the Index sat as a competitive advantage inside programs willing to use it, but the broader world of sport had a long enough development runway that bad decisions were survivable. A scholarship was a four-year bet. You had time to be wrong and time to develop. That world is gone. Athletes now arrive with price tags, transfer portals compress the window to a single season, and a misjudged dollar commitment does not dissolve over time. It sits on the books. The same formula Epley built out of desperation in 1969 is now precisely the kind of instrument the market is finally rich enough to need, because quantifying and pricing biology under time and money scarcity has become one of the most consequential decisions in sport.
The First Problem: Making a Jump and a Sprint Speak the Same Language
Before any of that could pay off, Epley had to solve a problem that sounds trivial and is anything but. A vertical jump is measured in inches. A 10-yard dash is measured in seconds. A pro agility shuttle is measured in seconds too, but in a different physical regime, dominated by braking and reacceleration rather than top-end velocity. Three numbers, three units, three scales. Asking whether a 35-inch vertical beats a 1.55-second split is like asking whether a kilogram beats a mile. The comparison means nothing until the quantities share a frame.
Standardization is that frame, and it is the same move a statistician makes with a z-score. You assemble a reference distribution from a very large population of athletes, tens of thousands of them across many sports and many years, and for each test you ask not what the raw number was but how far it sits from the population mean in units of standard deviation. A jump one standard deviation above the mean and a sprint one standard deviation above the mean now describe the same athletic accomplishment, whatever their raw units happen to be. The Index takes that standardized position and stretches it onto a single scale from 0 to 1,000 points. A world-record performance lands near 1,000. An above-average Division I mark sits around 500. The Division I average falls near 440.
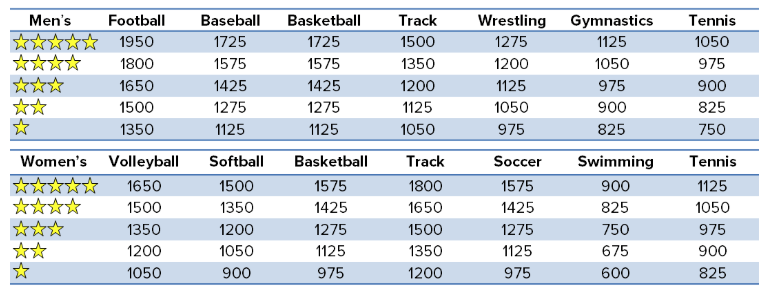
Here is something worth pausing on, because it is easy to underestimate. Most programs that try to build their own standards are working from a local dataset, sometimes their own roster, where the best athlete on the team still may not be very good, especially at programs trying to turn things around. What those percentiles measure is rank within a narrow, possibly mediocre pool. The Index measures rank within a genuine elite population, built from years of meticulous documentation at a program that was producing some of the most dominant power-sport athletes in the country. Nebraska in those years had extraordinary athletes across football, volleyball, and other power sports, and that population is what the standards were calibrated against. The mastery of the formula is not the formula itself. It is knowing what the biological value of a performance actually is within each specific weight class, and that knowledge took decades and tens of thousands of data points to accumulate. You cannot reverse-engineer that at home.
A raw percentile alone would not be enough, since percentiles compress badly at the extremes. Once a jump and a sprint are both quoted in points, they become commensurable. The points behave like a currency. You can take physical events with nothing in common, convert them into one denomination, and then add, rank, and compare them across athletes who look nothing alike. For a coach choosing between two players, that conversion is what makes the comparison mean anything at all.
The Curve Has to Match the Eye Test
Standardizing fixes the units problem but creates a subtler one, and this is where Epley did something genuinely ahead of its time. The naive way to hand out points is linearly, so that every equal gain in raw performance earns equal points anywhere on the scale. That assumption breaks against human physiology, because performance has a ceiling and improvement gets dramatically harder as you approach it. Taking two tenths off a 6.0-second time is close to trivial; a moderately trained person manages it in a few weeks. Taking the same two tenths off a 4.6-second time is a monumental feat that most bodies are simply not built to achieve. The marginal cost of a tenth of a second climbs steeply as you near the limit of the species, and a linear scale pays the trivial tenth and the monumental tenth the same wage.
A faithful scale has to be progressive, awarding points at an accelerating rate as the athlete approaches the ceiling. In the language of functions, the scoring curve is convex: its slope steepens toward the elite end, so the points earned per unit of improvement grow as performance improves. That convexity is built into the Index, and it matches the behavior Epley wanted, where an athlete already scoring high who improves a little earns more weighted points than an athlete scoring low who improves by the same raw margin.
The clearest public version of this is the system the Index was modeled on, the decathlon. The official tables run each event through a power law of the form Points = A times (P minus B) raised to the exponent C, where P is the performance, B is a baseline below which you score zero, and A and C are constants chosen per event. The character of the curve lives in C. For the explosive running events C sits around 1.8, comfortably above 1, which makes the function convex and rewards times near the world record far out of proportion to ordinary ones. For timed events the formula subtracts the performance from the baseline, since a lower time is better, but the convex shape is identical. The Index borrows that progressive structure and applies it to athletic testing, and then adds a step the decathlon never needed, because decathletes are built within a narrow range and football players are not.
The Value of Athleticism Is When Mass Is in Motion
The Index has to put a 300-pound offensive lineman and a 185-pound running back on the same scale and have the number mean the same thing for both, which forces a question most testing quietly skips. Athleticism is the ability to move your own mass through space in three planes of motion, so any raw output left unadjusted for body weight reports size as much as ability.
The adjustment cannot be a simple division by bodyweight, because force and power do not rise in step with mass. They scale allometrically. Muscular force tracks the cross-sectional area of the muscle, which grows with the square of a linear dimension, while body mass tracks volume, which grows with the cube. Carry that ratio through and strength scales roughly with mass raised to the two-thirds power rather than with mass itself. That exponent is why crude per-pound numbers mislead in a predictable direction. Divide a vertical jump by bodyweight and you flatter the small athlete every time; line up raw squats and you flatter the large one. Neither tells you who is the better athlete once size is held constant.
Epley avoided the trouble of estimating that exponent by hand and did something cleaner. He built a separate scoring curve for every weight class, in bands of about five pounds, and scored each athlete only against the population carrying the same mass. On a strength test, a heavier athlete has to move proportionally more weight to earn the same points. On a sprint or a jump, the standard tightens, so a heavy athlete who moves like a light one is credited for what is, in force terms, the harder accomplishment. The score that comes out reads like a power-to-weight ratio, and it is what finally lets the lineman and the back share a scale and answer the question that used to have no answer: with size taken out of it, which one is the better athlete?
Something worth understanding about why these three specific tests were chosen, because the selection was not arbitrary. Epley and his collaborators started with dozens of candidate tests. Over time, through the math and through the data, they converged on three. Not a med ball toss, not a plank, not a 100-yard dash. A vertical jump, a 10-yard dash, and a pro agility shuttle. The reason is that these three together cover the three primary vectors of athletic movement: vertical power production, horizontal linear acceleration, and lateral change of direction under load. Together they triangulate a body's ability to express force across three planes of motion. That is what athleticism actually is, and the economy of arriving at three tests to measure it, after starting with forty-plus, is itself a statement about the quality of the mathematics underneath.
One Number to Rank Them, One Shape to Fix Them
Run all three operations, standardize to a common scale, score on the convex curve, normalize within weight class, and each test yields a per-test Index score. Add the three together and you get a composite total, the headline number that modern versions display next to a radar chart of the individual scores. The composite makes athletes comparable across positions, sports, and genders, and it is what any star rating is built on. The radar chart preserves the detail underneath, and that detail is where the coaching happens. A tall, even shape describes a balanced athlete. A jagged shape, high on one axis and low on another, points at the quality holding the athlete back.
The three scores form a vector. The composite is roughly its magnitude, a single number you can rank and price. The shape is its variance: a low-variance profile is even and balanced, while a high-variance profile has an obvious weak axis that drags the whole thing down. Getting an athlete's scores to sit within about a hundred points of one another is really an instruction to raise the magnitude while shrinking the variance, a cleaner goal than "get better at everything" and a more honest one.
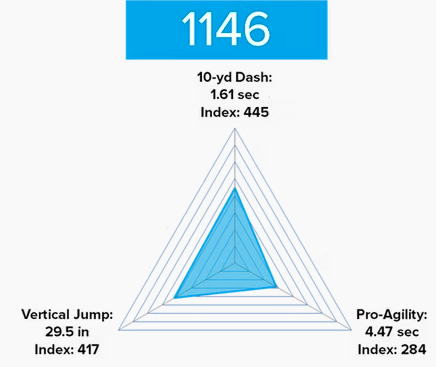
The vertical jump anchors all of it. It is the first quality to reveal itself in testing and typically the first to improve when training begins. An athlete with a very high vertical, say near 900 points, is telling you the engine is there, and the other two metrics will likely follow with proper training. An athlete sitting near 200 on the vertical is telling you something different and more limiting. There will never be a profile where the vertical is a 100 and the pro agility and the dash are 800 and 900. The vertical jump is the governing variable. The other two can be developed and shaped through training with greater responsiveness, but they operate within a ceiling set by the raw power the vertical reveals. Understanding the order of operations, engine first, then the trained qualities, is what separates a useful profile read from a superficial one.
The original purpose of this whole apparatus was not to identify stars. Boyd's framing was direct: a threshold of around 1500 composite points was not a target to chase, it was the line below which athletes consistently failed to reach NFL or All-American levels. The goal was filtering out the people who would waste the program's time, money, and effort in a room with 200 athletes trying out and a staff that could not develop everyone. One number to make the cut decision, and then a shape to tell you exactly what to build. That was the design, and it is still the most valuable thing about it.
What the Index Reliably Predicts Is Failure
People have wanted a high Index score to serve as proof that an athlete will be good. The mathematics will not carry that weight, and leaning on it that way is the most common mistake made with this tool or any derived composite index.
The reason is logical. A high score is a necessary condition for elite performance, not a sufficient one. A sufficient condition would let you predict success: clear the bar and you are great. No instrument built on physical tests can promise that, because everything separating a capable athlete from a great one, the skill and anticipation and vision and composure and feel for the game, lives in a space the Index does not touch. What the Index measures is the floor a body has to clear before any of those qualities get a chance to matter.
That logic only runs one way, and the asymmetry is the useful part. When an athlete scores above the threshold for their sport, the Index has cleared a constraint and then gone quiet, because whether the athlete becomes good now rides on everything outside the model. When an athlete scores below the threshold, the Index is saying something much stronger and more certain. A necessary physical condition is absent, and an absent necessary condition cannot be coached, schemed, or motivated into existence. That athlete will fail to execute at the speed the game demands, and they will fail in a way you could have seen coming.
The sports market has had this backwards for a long time. Recruiting and free agency chase the upside, treating a blazing forty as a down payment on stardom and paying accordingly. The honest signal points the other way. The Index stays quiet on who will be great, because greatness is genuinely uncertain. It speaks with near-certainty about who will fail, because that failure is dictated by physics rather than probability.
The Physics of the Newtonian Floor
The reason the downside is near-certain while the upside stays a guess comes down to the difference between a physical law and a statistical tendency. The floor is a law.
Every athletic task sets a mechanical requirement. To accelerate, the body has to drive force into the ground, and Newton's second law fixes the relationship: force equals mass times acceleration. For a given body mass, a demanded acceleration calls for a specific ground reaction force, produced inside roughly one-tenth of a second while the foot is actually in contact with the ground. If the athlete cannot generate that force relative to their mass, the acceleration never arrives. They do not produce it slowly or inefficiently. It simply does not happen, the way a motor below its rated torque fails to turn the load.
Change of direction shows the same physics even more plainly, and it explains why the front squat predicts the pro agility, a connection Epley's staff saw in their data long before anyone formally derived it. Reversing direction means killing your momentum and rebuilding it along a new line. The impulse-momentum theorem says the change in momentum equals force multiplied by the time over which it acts, so to reverse a velocity v the body must absorb and return an impulse on the order of two times mass times v, all of it inside a ground-contact window measured in milliseconds. With contact time effectively fixed, force is the only variable, and the force a body can put into the ground in that window is capped by its maximal strength relative to bodyweight.
This is the point that matters most when coaches argue about technique. When a player cannot execute a sharp change of direction, the instinct is to teach footwork, to drill the crossover step and the plant angle and the hip position. But if the prerequisite strength is not there, the technique has nothing to work with. The technique for changing direction is getting the squat up. Boyd Epley put it plainly: if you want to be fast, squat heavy, squat heavy fast. Once that foundation is built, the front squat trains the specific angles, the recruitment patterns, and the joint positions that transfer directly to change of direction on the field. The shuttle time is reading a force limit, and no amount of technique instruction can raise a ceiling that is set by force rather than by skill.
The same principle runs through every athletic demand the Index measures. Whether an athlete is gifted with natural power-to-weight from being a lighter, explosive body type, or whether they are a bigger athlete developing that quality through training, the physical floor governs what is possible. When a player struggles to execute at speed, the first question is not what play they ran or what foot they planted. The first question is whether the prerequisite physical capacity is there. If the vertical jump and the ten-yard dash show the engine exists, then the limitation in the agility is almost certainly trainable. If the vertical jump is low, the problem runs deeper, and the solution starts in the weight room, not on the field.
The Half the Index Does Not Price: The Hazard
Everything to this point prices capacity, what a body can do per pound at a single moment. It says nothing about durability, how long the body will keep doing it, and durability is where the field's mathematics still runs thin, because answering it calls for a toolkit borrowed from insurance and reliability engineering.
The central object is the hazard function, written h(t): the instantaneous rate of breakdown for an athlete who has stayed intact up to time t. Formally it is the failure density divided by the fraction still healthy, h(t) = f(t) divided by S(t). Accumulate the hazard over time into the cumulative hazard H(t), and the probability the athlete is still available at time t comes out as the survival function S(t) = e raised to the power of negative H(t). To compare two athletes you use a hazard ratio: in a statistical survival model each risk factor enters as a multiplier, so a profile carrying a hazard ratio of two is breaking down at twice the instantaneous rate of the baseline at every moment, all else equal. An actuary pricing a life policy and an engineer estimating the remaining life of a turbine use the same three functions. For a coach, what this means in practice is straightforward: given what you know about a player's body, training history, and physical profile, what is the probability they are still on the field for you in year two of the deal, or year three? The survival curve answers that question with a number rather than a guess, and the hazard ratio tells you exactly which factors are bending that probability up or down.
Once guaranteed money is attached to a body, this mathematics becomes the relevant kind, because the question has quietly shifted into an underwriting question. The expected value of an asset across a contract is its capacity weighted by its availability. Expected production equals projected production multiplied by the probability the athlete is actually available to produce it, integrated over every year being paid for. The Index supplies the capacity factor with real rigor. The availability factor, the survival curve, is the one the industry mostly eyeballs, usually by scanning an injury history on a page, which carries about the rigor of pricing a life policy off a single anecdote.
This is where the weight room stops being about development and starts protecting the investment. A program that adds muscle to grow cross-sectional area, thickens tendons through heavy loading, and builds the explosive maximal strength that underwrites change of direction is doing two things with one intervention. It raises the athletic floor, which lifts the Index, and it lowers the breakdown hazard, which pushes the survival curve outward. The same training that makes an athlete better also makes the guaranteed dollars likelier to survive the length of the deal. In that framing, the strength coach is reducing the probability of a value-destroying failure on an asset the program has already paid for, and that is a different and more compelling argument for the weight room than development alone has ever been.
Why Anyone Paying an Athlete Should Care Now
For fifty years this kind of analysis did not carry a price, which is why it stayed a quiet edge rather than a headline. College athletes were unpaid, and misjudging one cost a scholarship and a roster spot. That world is gone. Athletes now sign for real money, seven figures at the top, and the moment a dollar figure is attached to a body, every roster decision becomes an underwriting decision, in every sport, not only football. A softball staff splitting a capped pool, a basketball program weighing a transfer, a front office structuring a guarantee, all of them are doing the same thing now: pricing biology against a budget.
That is what makes the simplicity of the Index so easy to underrate. The entire apparatus is three tests, one scale, a convex curve, and a set of weight-class adjustments. It outperforms instrumentation that costs orders of magnitude more for a reason every modeler eventually learns: a model wins by capturing the essential structure of a problem, and resolution beyond that structure buys precision you cannot use and noise you have to fight. Epley built a population-calibrated, physics-shaped model of athleticism with almost nothing, and he got the structure right decades before the field had words for what he had done. The simplicity is the achievement.
For anyone with money on the line, the opportunity is concrete and it has a clock on it. Most of the market still behaves the old way, chasing the fastest forty, paying for upside, treating a torn hamstring as bad luck rather than a hazard that could have been priced. A buyer who understands the floor stops guaranteeing money to athletes the physics will never allow to succeed, the most expensive error in the sport. A buyer who understands the hazard stops watching guarantees die on the training table and starts using the weight room as a form of insurance. In a market this young, getting those two things right is worth millions over a roster and games over a season, and the edge lasts only until everyone else catches on.
It all traces back to a strength coach in 1969 who was told he would lose his job if anyone got slower. He answered that threat by building a way to know, with confidence, who was going to fail, and in doing so built the first real risk model for athletic talent without ever calling it one. The market needed fifty years and a flood of money to grow into what he made. Most of sports science measures the body, and measurement has become cheap. What the game is finally rich enough to want is a way to price the risk, and the Athletic Index has quietly been doing exactly that since before most of the people making today's decisions were born.
Frequently Asked Questions
What is the mathematical basis of the Athletic Index? Three operations. Standardization first: each raw result is expressed as its distance from the population mean in standard deviations and then mapped onto a common scale from 0 to 1,000 points, so seconds and inches become comparable. Then a progressive power curve, modeled on decathlon scoring, where points follow the form A times (performance minus baseline) raised to an exponent C greater than one. That exponent makes the curve convex, so gains near the elite ceiling earn disproportionately more than gains near the bottom. Finally, bodyweight normalization through a separate scoring curve for each weight class, which turns the score into a pound-for-pound measure of athleticism rather than raw output.
Why were these three tests chosen over all others? Epley and his collaborators began with more than forty candidate tests and converged on three through the data and the mathematics. The vertical jump, the 10-yard dash, and the pro agility shuttle together cover the three primary vectors of athletic movement: vertical power production, horizontal linear acceleration, and lateral change of direction under load. They triangulate a body's ability to express force across three planes of motion, which is what athleticism is. Arriving at three tests after starting with forty-plus is itself a statement about the rigor of the process.
What role does the vertical jump play relative to the other two tests? The vertical jump is the governing variable. It is the most direct measure of raw power production and the quality that responds most immediately to the athlete's underlying biology. An athlete near 900 on the vertical has an engine that will support development in the other two metrics. An athlete near 200 on the vertical is operating under a more fundamental constraint. There is no profile where the vertical sits at 100 and the other two tests are at 800 and 900. The vertical sets the ceiling within which the pro agility and the dash can be developed, and while all three qualities respond to training, the vertical jump is the first indicator of where the whole profile is likely to land.
Does a high Index score mean an athlete will be great? It does not, and this is the most misunderstood thing about it. A high score is a necessary condition for elite performance, not a sufficient one. Clearing the threshold removes a physical constraint, but whether the athlete becomes good then depends on skill, decision-making, and qualities the Index never touches. The dependable inference runs the other way. A score below threshold is a high-confidence prediction of failure, because a necessary physical condition is missing and cannot be coached around. The Index is honest about who will fail, and quiet about who will succeed.
Why is the downside prediction so much more reliable than the upside? Because the floor is a physical law, not a statistical tendency. The sport demands a certain acceleration relative to the athlete's mass, and force equals mass times acceleration. If the body cannot generate the required force for its mass, the movement is physically impossible. Violating a force constraint produces a fixed outcome. Satisfying it only permits a good outcome without guaranteeing one. The model is most reliable exactly where it is making the negative claim.
Why does the front squat predict change-of-direction ability? Reversing direction means absorbing momentum and rebuilding it along a new line. By the impulse-momentum theorem, reversing a velocity v demands an impulse on the order of two times mass times v, inside a ground-contact window of a few milliseconds. With contact time fixed, force is the only lever, and the force available in that window is capped by maximal strength relative to bodyweight. That cap is the front-squat number expressed on the field. Footwork drills cannot raise a ceiling set by force rather than technique. When coaches argue about technique on change-of-direction drills, the technique they are really describing is getting the squat up.
What does the Index not measure, and why does the gap matter? It prices capacity, what the body can do per pound right now. It does not price durability, how long the body will keep doing it. Durability is a survival-analysis problem governed by the hazard function h(t) = f(t) / S(t) and the survival curve S(t) = e^(-H(t)). The expected value of an athletic asset is capacity multiplied by availability, so a rigorous capacity number is only half the calculation. For any program attaching guaranteed money to athletes, the durability half of the equation is the open frontier.
How does training fit in as risk management? Adding muscle, thickening tendons through heavy loading, and building the strength that underwrites change of direction raises the athletic floor and lowers the breakdown hazard simultaneously. The same training that makes an athlete better also makes the guaranteed dollars likelier to survive the length of the deal. In that framing the weight room is not just a development tool. It is a form of asset protection, and the strength coach is reducing the probability of a value-destroying failure on a contract the program has already signed.
Does this apply to sports beyond football? Yes, because the mathematics is sport-agnostic. The three tests measure linear speed, change of direction, and power, which are universal currencies of athleticism across the power sports, and the weight-class normalization and population scaling work the same way regardless of the game. The only thing that changes between sports is the threshold an athlete has to clear. As guaranteed money spreads across college athletics, pricing the floor and the hazard becomes relevant to every program writing checks.
About the Author
Thomas Newman is the Founder and Chief Performance Officer of Newman Performance Systems (Newman HP), a concierge high-performance organization serving professional athletes across MLB and the NFL, collegiate programs, and high-performing executives. He spent five years at Yale University as Director of Student Performance and Innovation, overseeing 800+ student-athletes across 29 varsity teams and contributing to a National Championship in Men's Lacrosse and back-to-back Ivy League titles in football. He previously served as Chief Innovation Officer at Hawkin Dynamics and as a Lead Performance Specialist at Mass General Brigham's Center for Sports Performance and Research.
Thomas is a co-author of the Human Kinetics textbook Developing The Athlete : An Applied Sport Science Roadmap for Optimizing Performance Success(Kraemer, Ratamess, Newman, 2024), a peer-reviewed researcher, and a NSCA-Certified Strength and Conditioning Specialist since 2007. His work currently protects more than $151 million in active client career earnings.
To learn more about Newman HP or explore the free Coach's Toolbox, visit newmanhp.com. For inquiries about working with Thomas directly, reach him at contactus@newmanhp.com.